Showing posts with label data collection. Show all posts

Friday, 5 January 2024

Using board games to increase inclusion in research - a trivial pursuit?

Posted by Lesley Haley, AskFuse Research Associate, Teesside University 

Did you play any board games over the holidays? As we scrabble into 2024, have you ever thought about how they could be used as a way to engage people in your research?

I hadn’t, until I went to a recent Creative Methods in Research conference, where Kath Maguire (University of Exeter/NIHR School for Public Health Research) showcased how using board games in research was anything but trivial! Kath demonstrated the concept of using board games in public involvement and engagement can increase participation by reaching people less comfortable with standard formats of engagement or data collection, such as interviews or questionnaires.

Kath brought examples, like a “pairs” game used with public partners to break down barriers of understanding around the jargon used in research. Pairing research jargon, concepts or acronyms (‘randomised control’, ‘double blinded’, ‘SPHR’, ‘NIHR’ for example) with their plain English explanations allowed all participants to probe the underlying assumptions and constructs, and perhaps to reduce the power imbalance between the knowledge giver (usually researchers) with the knowledge receiver (usually public partners). And of course this game can be used to redress that balance by public partners sharing their knowledge with researchers.

However, the most surprising game that Kath has used in increasing involvement was the repurposing of that classic multicultural game, Snakes and Ladders.

While AskFuse (the responsive research and evaluation service run by Fuse) created the pictured Snakes and Ladders game as an interactive way to explore successes (Ladders) and setbacks (Snakes) of getting research knowledge used in practice, Kath has taken the game to a whole new level.

Kath has a wealth of experience in using board games as a creative method of inclusion to reach people less comfortable with more literacy-based research methods. They bring a blank paper board and a variety of stick-on snakes and ladders as a visual prompt to generate discussion and reflection using the metaphor of the game to explore a range of experiences. The aim is not necessarily to play the game, but to use the building of a bespoke “game” to reflect and “illustrate” narratives and experiences.

Participating in Kath’s interactive workshop was, for me, a real game changer. We explored how using snakes and ladders enabled discussion, reflection and inclusion. We could design our own individual game to tell our story, or do it collaboratively. We used the game layout as a metaphor for exploring changes through time or to illustrate a “journey” (for example, exploring access or barriers to health services). It allowed us to describe and reflect on different pathways or starting points. Being a physical representation of our narrative meant that, at times, “gaps” emerged which led to questions around “what was happening here?” and “what are we missing?” The grid could also used to reflect emotional journeys in response to a given (research) question or situation. We explored how focussing on a game allowed for different viewpoints to emerge and for less vocally confident people to engage without having to “carry” a conversation or justify their experience. The game squares could be filled with comments, contributing factors, and ideas. We reflected that the snakes and ladders could be reconfigured for creative re-imagining of time/place/situations - “what would happen if we did this”? And of course the complexities of the research process can be illustrated through the metaphor of Snakes and Ladders.

At the end of the session, there was a tangible product and graphic representation of the research question, the process and the outcomes of the exploration. We reflected that over several sessions, the game would perhaps change and this progress could be captured in photos. The “game” could also then be used creatively to disseminate the research (Coon et al 2022).

We also explored the risk that a gaming method for engagement or data collection, especially in the “Snakes & Ladders” format, could be seen by some people as trivialising the serious business of research, as in the UK it is perceived as a child’s game. However the game is not all it appears. Originally known in “Moksha Patamu”, it was a philosophical game of actions and consequences for adults developed in ancient India (Museum of Gaming 2015). Over time and locality, the game has evolved into other versions, with snakes transformed into “drainpipes” or “chutes (Start the Week 2023). So the game has a tradition of being adapted and re-purposed and perhaps we should not be shy of re-purposing it to make research more accessible?

Since Kath’s workshop, I’ve had a quick look around to see if there are other researchers using gaming. While there is literature on using board games in health education and promotion (Nakao 2019) and public health policy (Spitters 2018) there seems less on the use of board games in public involvement and engagement in health.

Of course, snakes and ladders doesn’t have the monopoly on being the only board game that can be used. So, do you use board games in your research to engage with people and communities? What's been your experience of what works for who? How do you pitch it? What have you found the setbacks and successes of using board games as a creative way of engaging people and communities?

As you scrabble to fit all the board games back into the cupboard after Christmas, maybe it’s time to reflect that participatory board games in research could be for the rest of the year too, not just for Christmas.

With thanks to Kath Maguire for the interactive workshop and to SPHR for funding attendance at the conference.


References:

Coon, J.T., Orr, N., Shaw, L. et al. (2022) Bursting out of our bubble: using creative techniques to communicate within the systematic review process and beyond. Syst Rev 11, 56 https://systematicreviewsjournal.biomedcentral.com/articles/10.1186/s13643-022-01935-2

Kath’s work:

Museum of Gaming Newsletter (2015) Issue 2 Snakes and Ladders History. Accessed 2 Jan 2024 Available at: https://www.museumofgaming.org.uk/documents/Newsletter2.pdf https://www.museumofgaming.org.uk/index.cfm

Nakao M (2019) Effects of board games on health education and promotion” board games as a promising tool for health promotion: a review of recent literature BioPsychoSocial Medicine (2019) 13:5 https://doi.org/10.1186/s13030-019-0146-3

Spitters H.P.E.M , van de Goor L.A.M, Juel Lau C, Sandu P , Eklund Karlsson L , Jansen J, van Oers J.A.M (2018) Learning from games: stakeholders’ experiences involved in local health policy Journal of Public Health | Vol. 40, Supplement 1, pp. i39–i49 | doi:10.1093/pubmed/fdx149 https://academic.oup.com/jpubhealth/article/40/suppl_1/i39/4925598

Start the Week: Playing Games (2023) BBC Radio 4 Monday 4th December 2023 09.00 Available at: https://www.bbc.co.uk/sounds/play/m001t2xq?partner=uk.co.bbc&origin=share-mobile (Accessed 8 Dec 2023)

Friday, 13 October 2017

From shock to the system, to system map and beyond: evaluating the UK sugary drinks tax

Guest post by Jean Adams, Centre for Diet & Activity Research (CEDAR), University of Cambridge

Mostly you don’t get to watch TV at work. The day that George Osborne announced he would introduce a tax on sugary drinks in the UK, here at CEDAR HQ we all stood huddled around a computer monitor watching and re-watching the words coming out of his mouth. 

Oh. My. Goodness. I did not see that coming. 

The “soft drinks industry levy”, to give it it’s proper name.

A rather senior professor has since told me that he totally saw it coming.

After we’d got over the shock of the announcement, the conversation turned pretty quickly to research (well, this is a university, after all). We have got to evaluate this!

Colleagues at CEDAR had already written papers about how sugary drink taxes could be evaluated. We had talked with colleagues in other countries about evaluating their taxes – only for those taxes to fall through at the final political hurdle. I have more than one half-written application for research funds to evaluate sugary drink taxes stashed down the back of my computer.

And here it was, all systems go for designing an evaluation for a UK sugary drinks tax! In our back yard!

OK, so we have to work out whether it impacts on diet. But, what about jobs? Will people lose their jobs? Surely we need to know if it changes price and purchasing of sugary drinks. Right, but even if it does people might just shift to other foods – maybe they will just eat more cake instead? We are Public Health researchers, we need to focus on health: does the tax change how many people get diabetes? Or tooth decay? Or the number of obese children? And what about how this even happened? Did you see it coming? Why has this happened? Why now? Why don’t we do interviews with politicians and find out how it happened?

Woah, woah, woah! Ten seconds in and this is getting way more complicated than we (I) had ever thought it might. Before we did anything, we needed to work out what we thought might be going on here. Once we understood what the potential impacts might be, then we could start thinking about how we might evaluate them.

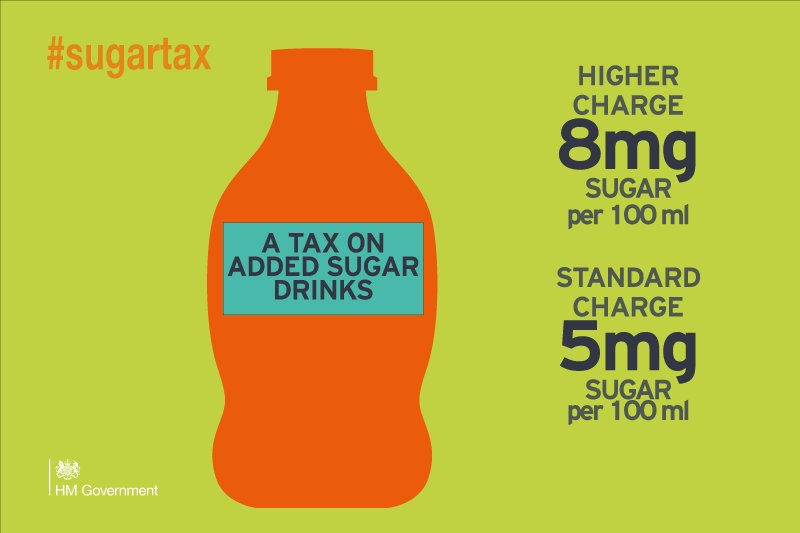
So that’s what we did. We spent 6 months developing a ‘systems map’ of the potential health-related impacts of the UK Soft Drinks Industry Levy (aka sugary drinks tax). The tax is explicitly designed to encourage soft drinks’ manufacturers to take sugar out of their drinks. There are two levels – a higher tax for drinks with the most sugar, a lower one for only moderately sugary drinks. So we started there (at ‘reformulation’) and worked out.

Then we sense-checked our map with people working in government, charities, and the soft drinks industry. They made lots of suggestions for things we’d missed, or needed to clarify. We changed our map and asked people to check it again. We changed it again. Only then did we decide what we should, and could, evaluate.

The current version of our systems map (we still think of it as a work in progress). Larger version here.


Yes, we are going to look at how the price of sugary drinks changes over the next few years. But we are also going to look at the amount of sugar in soft drinks in UK supermarkets, and the range of drinks available. We’re going to use commercial data to look at purchasing of soft drinks, as well as other sugary foods. We’ll use the National Diet & Nutrition Survey to explore whether there are any changes in how many sugary drinks, and other sweet foods, people in the UK eat. We’ll use hospital data to see if the number of children admitted with severe dental decay decreases. We’ll use statistical modelling to predict how changes in how many soft drinks people drink might translate into cases of diabetes and heart disease. We’ll look at the impact of the tax on jobs, and the economy. We’ll explore the ‘political processes’ of why and how this tax happened at this time. And we’ll conduct surveys to find out what people in the UK think of sugar, sugary drinks, and the tax itself – and whether this changes over time.

Obviously it’s going to be a lot of work. We’re going to need some excellent people to join the team to help us actually do this thing. Personally, I’m feeling a little overwhelmed/excited/overwhelmed/excited. It’s going to be brilliant!

Wanna be part of it?

Friday, 23 June 2017

Automatic academic: working myself out of a job

Guest post by Emma Foster, Lecturer in Public Health Nutrition, Human Nutrition Research Centre, Newcastle University

Since I started working in dietary research I’ve been fascinated by how and why people misreport their dietary intake. Lots of excellent research (by others) has gone into understanding how the hassle of recording food intake, problems with memory and attention (if you are busy doing something else at the same time you may not be paying attention to what you are eating) along with social-desirability bias (am I really going to admit to the nutritionist interviewing me how many doughnuts I ate yesterday!) together tend to result in an under-estimate of energy intake and an over-estimate of those foods seen to be “healthy”.

Much of my research has focused on how we can make it less of a burden and perhaps even an enjoyable experience for volunteers taking part in nutrition research studies. I developed food photographs for portion size estimation with children, so participants don’t need to weigh everything their child eats….and more importantly doesn’t eat but ends up wearing!

Food photographs estimate portion size with children, so participants don’t need to weigh everything their child eats (or ends up wearing!)


More recently I’ve been developing an online 24-hr recall system, which sometimes feels like I’m making myself and other nutrition researchers surplus to requirements! In the “olden days”, when I first joined the Human Nutrition Research Centre at Newcastle University, all dietary data was collected by a researcher who went out to people’s homes to interview them about their dietary intake (something I really quite miss). This was followed by day after day sitting at a computer linking the foods and drinks reported to food composition data and weights (which I don’t miss quite as much!). Now with the online recall we are able to collect the data remotely. We send people a URL and login details and the computer system does the rest. It takes them through the previous day, asking for details on foods consumed, getting people to estimate portion size using photographs and checking for forgotten items like butter on toast or sugar in tea. The system automatically does the linking to the food composition data and the weights consumed and the researcher can download the data as soon as the volunteer has submitted their recall.

More beans please. A screenshot from INTAKE24


But surely it doesn’t do as good a job as a highly skilled nutrition researcher such as myself….right? Well it’s not actually that far off! When compared with a traditional face-to-face interview with 180 people the system was found to underestimate energy intake by just 1% on average and average intakes of protein, carbohydrate, fat, vitamins and minerals were all within 4% of the interviewer-led recall. Perhaps most amazingly people reported enjoying completing the system!

So if you would like to measure food intake as part of your research but can’t afford to employ a nutritionist/dietitian as part of your research team (we’re not cheap) then have a look at our demo on https://intake24.co.uk/demo and drop us an email at support@intake24.co.uk and we can set you up a survey straight away – and it really is free.

Friday, 10 March 2017

How I overcame my scholionophobia... a clinical pharmacist in an academic world

By Rachel Berry, Specialist Antibiotic Pharmacist, County Durham and Darlington NHS Foundation Trust, and Health Education England (HEE) and National Institute for Health Research (NIHR) Intern 2016/17

“Scholionophobia* – A fear of school, college or university”

So, I want you to picture the day ….. It was a sunny September morning and there I was, a clinical pharmacist currently working in hospital, standing by the River Tees at Queen’s Campus Stockton about to enter Durham University. And I was terrified. Honestly, the last time I was this scared walking into a university building was in 2004 and I was about to sit my Registration Assessment to become a qualified pharmacist. I was obviously suffering from scholionophobia.

Courtesy of mothmediatech & the creators of The adventures of Worrisome Wilf books

“But why were you so scared?” I hear you ask. Well, the answer is that I was just about to start my Health Education England (HEE) and National Institute for Health Research (NIHR) Integrated Clinical Academic Internship programme.

The HEE/NIHR funded internship is a programme to enable Healthcare Professionals working in clinical practice to gain research experience and skills by working alongside a university academic. I had ahead of me, 30 days away from my clinical commitments that I could use to gain an introduction into clinical academic research.

My fear was based on the fact that I didn't know anything about research or universities. Not one bit. And I definitely wouldn't be able to do it myself. In my mind, research was only done by brilliantly clever people who know everything. I was only a lowly hospital pharmacist. I was pretty sure that I would be the most stupid person there!

Fortunately for me, I was about to meet my amazing academic mentor, and go on an adventure into the unknown world of research. I have gained experience and skills in literature searches and critical appraisal, project design and data collection, statistics, statistical analysis software (SPSS) and writing for publication. I have met so many talented, lovely people who have been interested and willing to help me, even when I probably was the most stupid one there (try explaining Poisson regression and statistics to a person who doesn’t have A-level maths!). It really has opened my eyes to the world of research, and the possibilities for clinical practitioners. My mentor has helped me realise that the skills and experience I have from clinical practice are just as important in clinical research as the skills of doing the research.

I am now coming to the end of my time. I have completed my project, which will be disseminated to local Clinical Commissioning Groups (CCGs) to enable them to focus on key target areas to improve patient safety within antibiotic prescribing. I am also planning on publishing it, and hopefully this will allow the work to have wider impact. I have been able to take what I have learnt about research and its impact on patients back to my clinical work too. This has meant that I am more reflective and research-aware when doing my job. I have also shared this with the colleagues in my department, and hopefully encouraged them to be more research aware and active, to enable us to provide better care to our patients.

In the future I would love to do more research in conjunction with the School of Pharmacy as I have realised that blending our skills and experiences, whether they are clinical or research based, can lead to more relevant patient-focussed clinical research being undertaken. I am also trying to get other members of my department to apply for the Internship next year.

The 30 days spent at Durham University were some of the most challenging, interesting, frustrating and rewarding I have ever spent at work. My scholionophobia has been cured, with no medicines required. If you are a sufferer in clinical practice, I would recommend talking to academics in your clinical speciality and applying for the Internship; there is no need to be scared. And if you are an academic in health research there is a wealth of experience that you could utilise within the clinical teams; they would probably love to be involved, they just might be too scared to ask.


My thanks go to the team at North West Research and Development who ran the 2016/17 Internship Programme on behalf of HEE/NIHR. Also thanks to my managers at County Durham and Darlington Foundation Trust, and especially to Professor Cate Whittlesea and the School of Medicine, Pharmacy and Health at Durham University.

*Also known as Didaskaleinophobian or Scolionophobia.


Thursday, 1 December 2016

The biology of inequality and the role of the generalist

Guest post by Tony Robertson, Lecturer in Public Health, University of Stirling

My research focuses on trying to better understand how our cultural, social and economic circumstances ‘get under the skin’ to impact on our physiological systems and influence our health and the development of disease. The emergence of this field investigating the social-to-biological transition has grown over the last twenty years with the increased availability of biological measures biomarkers in many of the large, population-based health and social surveys such as Understanding Society and the English and Scottish Health Surveys. This growth in collecting simultaneous biological and social data, longitudinally (repeatedly over a period of time from the same individuals) and across the life course, is key if we are to continue to advance our knowledge of the biological and health impacts of our environments and society. So far, much of the evidence is based on cross-sectional data (data collected at only one point in time, rather than repeatedly) or where we have biomarkers measured once, but with repeat social data for the same individuals over a number of years. However, studies such as Understanding Society are beginning to provide us with biological measures from the same individuals measured over several years. This type of longitudinal data will help us to better understand how our bodies change over time and the relative importance of different stages of our lives (for example, childhood versus young adulthood).

The increase in data linkage to routinely collected data records (e.g. education surveys linked to health records) is also allowing us to research the long-term health consequences of social and economic circumstances, even after studies and surveys have stopped running. It may also be possible in the future to carry out such linkage between health and social data with biomarker data, collected when visiting your doctor for example. There are obviously many ethical, financial and practical challenges and questions linked to these types of data linkage ideas, but they offer possibilities to broaden our knowledge of the social determinants of health. It is also becoming slightly more common to see intervention studies including biomarker measures that will allow us to see the physiological effects that will be occurring long before we ‘feel’ or see changes in health, perhaps changing how we can demonstrate ‘effectiveness’.

Public health and social epidemiology are often multidisciplinary pursuits, or at least many of us arrive working in these fields from multiple academic and professional backgrounds. However, there remains a need for greater cross-discipline collaborations to help us better study the links between our social, cultural, environmental and political circumstances and our wellbeing, health and physiology. I am keen to see more biologists, epidemiologists, social scientists, statisticians etc. work together on these projects. I trained as a biologist up to and including PhD-level before moving into public health and social epidemiology. One of the key roles I now fulfil (and enjoy) is acting like a match-maker, and sometimes a translator, for lab scientists and social and public health scientists to come together to work on research projects. This type of role is becoming ever more common, especially in public health where we need a mix of specialists and more of these generalists, with expertise across a range of disciplines. This is by no means an easy role to play as it can mean being the conduit to link specialist researchers and/or practitioners together without then being able to play a leading role in the development and implementation of these research studies. It’s the ‘jack of all trades, master of none’ issue. However, without these generalists with interests and expertise that span multiple disciplines we continue to risk limiting innovation and interaction to help impact on areas like health inequalities. Perhaps the saying ‘a jack of all trades is a master of none, but oftentimes better than a master of one’ is a better representation of what I’m aiming for. I hope.

If you’re interested in finding out more, please visit Tony’s website www.BiologyOfInequality.com and you can also find him on Twitter @tonyrobertson82 

Photo attribution: 
  1. “jack-of-all-trades” by shai aharony via Flickr.com, copyright © 2016: https://www.flickr.com/photos/139807035@N05/25607414481 
  2. “match_maker_love_machine” by Capes Treasures via Flickr.com, copyright © 2012: https://www.flickr.com/photos/26652069@N07/8390808924

Wednesday, 2 November 2016

Too stressed for words? Involving those experiencing stress in research (part 2)

Posted by Fuse members Sonia Dalkin, Lecturer in Public Health and Wellbeing, and Natalie Forster, Senior Research Assistant, Northumbria University

Following on from our post last year on National Stress Awareness Day, and in light of the current media attention paid to welfare benefits, we wanted to take the opportunity to reflect on the difficulties of involving those experiencing stress in research. This is in relation to our recent recruitment efforts for a realist evaluation of the impact of Citizens Advice (CA) on health.

"Stress" by Bernard Goldbach
CA provide independent, impartial, confidential, and free advice to everyone on their rights and responsibilities. This includes advice on debt, benefits, employment, housing and discrimination. Throughout the study, a recurrent theme of stress has been evident. The links between stress and health are abundant. This stress lens therefore formed the health focus of the study, overcoming the difficulties of recording the variety of outcomes leading to health improvements and capturing changes to health which would only be evident beyond the study timescale. Determining if and how CA services reduce stress should enable us to project the potential health impact of CA.

We carried out a mixed methods evaluation, detailed here. This required CA clients to complete a questionnaire when they first accessed CA and six weeks later. CA staff collected the questionnaire data for the research. Twenty-seven clients were also invited to participate in interviews. CA staff were initially apprehensive about data collection, due to clients often being in crisis and therefore having extremely high levels of stress.

Initially, recruitment was very slow. This was due to a variety of factors, some of which could be related to stress:
  • Some clients were too stressed to engage in completing the questionnaire at Time 1 (initial contact with CA).
  • CA staff found it extremely difficult at times to get in contact with clients at Time 2 (six weeks later). This was often due to their own heavy workload but also due to client reluctance to answer calls from unknown numbers (CA has a withheld number) and client wishes to move on with their lives once issues had been resolved.
  • Clients were reluctant to participate in interviews because they were too stressed and had often been let down by other organisations when disclosing personal information. 
  • Some clients also suffered from severe mental health issues which meant they found the prospect of an interview very stressful. 
To overcome these barriers, several strategies were employed. These were developed collaboratively with CA, and through engagement with the project steering group.

  • We worked with CA staff to develop a bespoke questionnaire, meaning that CA staff felt confident that it was not over burdensome for clients. This included shortened versions of questionnaires where possible. Questionnaires were also carried out by a client’s named CA contact who they trusted and would be more comfortable disclosing information to.
  • We ensured that CA staff had a detailed understanding of the research aims in order to explain the research clearly to participants and gain their trust in the research. They could therefore highlight the importance of completing the Time 2 questionnaire to participants. When participants understood that the research aim was to show the ‘good work’ CA do, as opposed to focusing on their issues, they were more likely to engage. 
  • Offering interviews at a client’s home or via skype, in addition to the original offer of interviews at CA Gateshead allowed for participants to be in a location where they felt most relaxed.
  • Offering clients the option of having their named and trusted CA staff member attend the interview for the first 10 minutes allowed this trusting relationship to be transported to the interviewer.
  • Offering clients the option of having a relative or friend attend the interview also helped to put the client at ease. In one case, the client gave permission for their partner to do the interview on their behalf as they had been highly involved in the process of interacting with CA.
These improved strategies led to the collection of 261 Time 1 questionnaires with a 92 per cent follow up rate, and 23 clients participating in interviews.

Although CA staff were initially apprehensive about data collection, working in partnership and being flexible with recruitment strategies overcame this. It is important to provide all clients with the option of participating in research; presumptions of non-participation remove client autonomy which is unethical. In this research project and all research with people experiencing difficult circumstances it is essential to involve - where possible - any potential participants, the organisations working with clients, and experts, to find the most fruitful recruitment strategies.


The CA research team also consists of Monique Lhussier (Reader in Public Health and Wellbeing); Philip Hodgson (Senior Research Assistant) and Sue Carr (Professor of Public Health Research), who have all read and contributed to this blog post.

The study ‘Exposing the impact of advice services on health and inequalities’ is funded by the NIHR School for Public Health Research (SPHR), via the Public Health Practice Evaluation Scheme (PHPES). The views expressed are those of the author(s) and not necessarily those of the NHS, the NIHR or the Department of Health.


Links:


Photo attribution: “Stress” by Bernard Goldbach via Flickr.com, copyright © 2011: https://www.flickr.com/photos/topgold/6273248505

Thursday, 15 September 2016

Dealing with emotions and breakaway training: reflections on collecting survey data in a prison

Guest post by Jennifer Ferguson, Research Associate (Alcohol Team), Teesside University

“Wear tracksuit bottoms, bring your trainers and be prepared for Judo style moves” – not something you hear every day when trying to set up data collection. Working in a prison has been an eye opener, in ways I expected, and in ways I could never have anticipated. I sit on F wing, the wing that prisoners are brought on to when they arrive. It is in the middle of this wing that I carry out surveys about brief alcohol interventions with each new prisoner for a research project at Teesside University.

When I think back to the phone call I received about “breakaway training” and how I felt on that day, (being told how to physically hurt people should I be attacked, and kicking grown men) it was all very useful and I believe necessary when working on a prison wing. However, what I should have been preparing for was how mentally challenging it is. Prison staff become hardened (through lack of choice) to what happens in there, they have to become emotionally disentangled from each prisoner, and some literally make fun of the inmates. Of course we need to know how to hide our keys, get out of basic holds, locate the alarms and know basic breakaway techniques. But the awful feeling I felt in the pit of my stomach for a vulnerable new prisoner who enquired as to where everyone was going with their towels (they were lining up for the showers), and who was told by another inmate: “swimming mate, you wanna go? Just go up there and ask ‘Mr Jones’”, will stay with me for a long time.

Prisoners don’t expect you to be nice to them, and no one uses first names. It is surnames for prisoners and Sir and Miss for staff. They don’t touch you, even to shake your hand. The language is horrific. This is just the way it is. So in my first few weeks - hearing ‘Thompson’ tell me about how he misses his wife and kids, ‘Scott’s’ emotional breakdown because he is terrified of being inside, and ‘Smith’s’ heartbreak about his childhood and battle with drink and drugs - I soon realised I didn’t need to know how to defend myself against anyone. What I needed to learn, and fast, was how to switch off emotionally in front of these grown men. I am an emotional person and could easily fill up with tears in an instant at some stories. In my time as a researcher, when writing papers, collecting data in various formats and spending hours inputting it into a statistics software package, I have never had to deal with grown men crying. That being said, I am told every day by the peer prisoners not to believe everything I am told. I will learn how to deal with my emotions and what prisoners tell me… and by then be finished data collection. I wonder if my perspective will change the more time I spend in there? 

I guess my point is that I am learning that you cannot understand everything in public health research from articles and text books. A class room cannot prepare for you for the mental challenge of working in prison setting. However, this difficult piece of data collection will be vital to our study and my development as a researcher.

Photo attribution: “Jailed.” by disastrous via Flickr.com, copyright © 2008: https://www.flickr.com/photos/bienaventurada/2912658697

Wednesday, 4 November 2015

Too stressed for words? Involving those experiencing stress in research

Post by Fuse members Natalie Forster, Senior Research Assistant, Northumbria University and Sonia Dalkin, Lecturer in Public Health at Northumbria University

On this National stress awareness day, we wanted to take the opportunity to reflect on the ethics of involving those experiencing stress in research.

Fuse researchers are currently undertaking a realist evaluation to understand how, when and for whom, Citizens Advice Bureau (CAB) interventions improve people's health. CAB provide independent, impartial, confidential, and free advice to everyone on their rights and responsibilities. This includes advice on debt, benefits, employment, housing and discrimination.

Changes to physical health take a long time to show, and are therefore difficult to capture in the evaluation timescale. The impact of CAB on stress therefore forms a core focus of the study. As we know already that stress is linked to many mental and physical health outcomes, determining if and how CAB services reduce stress should enable us to project the potential health impact of CAB.

At the point when people approach CAB, they are often under considerable strain. Two in three people accessing CAB services report feeling stressed, depressed or anxious as a result of the problem or problems that they are experiencing, more than one in five people have had to move home or are worried about losing their home, and almost one in five are experiencing difficulties in relationships with other people.
We have had much discussion as a research team, together with CAB staff, around how to design the research in a way that generates sufficient data to assess the impact of the service, but which remains sensitive to what clients are experiencing. Imagine a scenario for example, whereby you approach a service for help already under significant stress, you are anxious to resolve a financial problem, yet before you can start to address the issue you're asked to fill in a lengthy questionnaire about your health. Furthermore, CAB have projects specifically designed to support those diagnosed with cancer. In the case of CAB clients who are currently undergoing treatment for, or supporting a family member with cancer, stress is likely to remain in spite of addressing financial concerns, and to ask if their health has improved would be inappropriate.

These are just some of the issues we've been grappling with and which have informed our decisions about which client groups we invite to participate, when we contact potential participants, and what they can reasonably be asked to take part in. A decision was made for instance, not to include a project for patients and families with cancer among those being evaluated. Baseline questionnaires will not be delivered before, but rather during or just after clients’ initial appointments. The number of questionnaires clients will be asked to complete has been carefully considered and where possible, shorter versions of questionnaires have been used in order to avoid over-burdening participants.

That said, we're also conscious of the risk of excluding people from taking part by making too many presumptions about participant preferences. We have often reflected during involvement with previous research on how generously people have shared their time and experiences even when undergoing difficult circumstances. We therefore continue to consider the balance between participant protection and autonomy when recruiting potentially stressed participants. In research with people experiencing difficult circumstances, involving potential participants and organisations working with them in designing data collection strategies is key to ensuring their appropriateness.

Photo attribution: Photograph ‘Anxious 1’ (File ID #1431663) by Joana Croft via freeimages.com, copyright © 2007: http://www.freeimages.com/photo/anxious-1-1431663

Did you enjoy reading this post? If so, please vote for Fuse in the UK Blog Awards 2016 by clicking here

Thursday, 2 July 2015

Collaborative research: agreeing to disagree?

Posted by Peter van der Graaf

Fuse sponsored a parallel session at the Faculty of Public Health conference last week in Gateshead, chaired by Professor John Ashton CBE, President, UK Faculty of Public Health. The session focused on the challenges and opportunities of collaborative research between academics, health practitioners and decision makers.

The four papers presented in the session outlined different challenges in collaborative research: Alyson Learmonth, reviewing Health and Wellbeing Strategies in the North East, highlighted the diversity in priorities between different areas, making it difficult to focus and combine resources across local authorities.

Silvia Scalabrini showed that, in spite of dedicated health economic support from academics to local public health teams in prioritising their investment and resources, the use of these formal tools was met with resistance by elected members who put a higher value on other sources of information, such as stories from residents.

I highlighted limits to collaborative working through a mismatch in timescales, funding and interests. For example, academics showing limited enthusiasm for applied research due to a lack of incentives within their institution, which put a higher value on high quality publications and research council funding.

Fuse Director Professor Ashley Adamson talked about the challenges in setting up data sharing agreements with different local authorities to access National Child Measurement Programme (NCMP) data, in spite of positive support and demand for the research from local government.

Listening to these presentations one might wonder whether collaborative working is really possible. At the same time, each presentation offered examples of where it was achieved and made a difference. For instance, Alyson Learmonth's appreciative enquiry demonstrated common interests between Health and Wellbeing Boards (HWBs) in giving each child the best start in life and in the social determinants of health, particularly interventions around education and housing.

Silvia Scalabrini highlighted the usefulness of the Portsmouth Scoring Card, developed by Austin, Edmundson-Jones, and Sidhu (2007)* for local authorities to prioritise their spending. I reflected on the value of responsive research services, such as AskFuse, to provide backstage negotiation spaces for what constitutes useful evidence. Professor Adamson discussed the benefits of matching data from the NCMP with local intelligence to increase the effectiveness of child obesity interventions and their evaluations.

I’m wondering where this leaves us? In spite of problems in setting priorities, even agreeing on the tool to do this, limits to willingness and capacity among academics and public health practitioners to collaborate on research projects, and barriers in data sharing once a project has been agreed, the different examples made it clear that not collaborating was simply not an option.

Public health practitioners have limited resources and lack the capacity to analyse and interpret data, while academics are increasingly required to demonstrate the impact of their research and lack an understanding of the context and processes in which evidence is used in practice. Working together is a must to ensure that public health can provide an answer to the questions it is currently being asked.

Moreover, the number of participants from academia and practice at the conference session, demonstrates that there is a clear appetite to work together on these issues as long as we are able to provide the conversation spaces for this.


*Reference. Austin, D., Edmundson-Jones, P. and Sidhu, K. (2007) Priority setting and the Portsmouth scorecard: prioritising public health services: threats and opportunities. Available at: http://www.publichealthconferences.org.uk/health_services_2007/presentations.php

Did you enjoy reading this post? If so, please vote for Fuse in the UK Blog Awards 2016 by clicking here

Thursday, 11 December 2014

52 weeks in public health research, part 49

Posted by Catt Turney Amelia Lake and Mark Welford

 
 Posted by Catt Turney: One of the photos taken by my colleague Britt Hallingberg at the DECIPHer symposium, where staff and students from the three partner universities (Cardiff, Bristol and Swansea) get together to discuss how our research is going and celebrate key achievements. As there are so many of us now we're only able to sympose once a year, and organising an ice-breaker at the beginning of the day is no mean feat. Luckily we had Dr. Jeremy Segrott (on the left, waving his arms in the air) on hand to conduct the task with aplomb. The ice-breaker involved a highly sophisticated and technically advanced approach to finding out our views on various subjects, by situating ourselves appropriately along a piece of string. This particular photo illustrates our views on mornings, about which we appear to have mixed feelings.
 
 
Posted by Amelia Lake: At this week's Fuse Members' Day - which was more popular? Fruit or crisps? (Disclaimer there were more bowls of crisps!!)
 
 
Posted by Mark Welford: Scott Lloyd demonstrating Mosaic, Experian's system for classification of UK households at the Fuse Members' Day. Mosaic is one of a number of commercially available geodemographic segmentation systems, applying the principles of geodemography to consumer household and individual data collated from a number of governmental and commercial sources. It's a bit scary how much it can churn out about you, your neighbours and where you live by simply entering a postcode!
 
 
Posted by Amelia Lake and Mark Welford: Fuse Director Ashley Adamson drawing to a close our Fuse Members' meeting at Durham University. A great meeting with lots of opportunities to catch up with colleagues from the five Fuse institutions and beyond!
 
The meeting was jointly hosted by the Fuse Communications Group and Knowledge Exchange Group and was centred around a blog post written by Scott Lloyd, Health Improvement Commissioning Lead, Redcar & Cleveland Borough Council.  He and his colleagues kindly agreed to give up there time to talk to us about improving partnerships, research and health.
 
This photo also shows off the new Fuse and AskFuse banners!
 
------------------
A reminder from the Fuse blog group:

Each Thursday of 2014 we’ll try and post around four pictures on the Fuse blog that capture our weeks in public health research, from the awe-inspiring to the everyday and mundane. Given that more of the latter than the former exists in most of our lives, we foresee problems compiling 208 images worth posting on our own. So this is going to have to be a group project. Send an image (or images) with a sentence or two describing what aspect of your week in public health research they sum up and we’ll post them as soon as we can. You don’t have to send four together – we can mix and match images from different people in the same week.

Normal rules apply: images you made yourself are best; if you use someone else’s image please check you’re allowed to first; if anyone’s identifiable in an image, make sure they’re happy for it to be posted; nothing rude; nothing that breaks research confidentiality etc.

Email your posts to m.welford@tees.ac.uk or contact any member of the Fuse blog group.

Tuesday, 4 June 2013

Data collection

Posted by Heather Yoeli

What follows is the hypothetical transcript of a conversation I’ve had a few times recently:

COLLEAGUE Heather, hello! Where have you been for the last few months and why didn’t you reply to that email I sent round about the night out?

ME Hi! Sorry I’ve not been around. I’ve been busy with fieldwork with participants, and have been interviewing people for my PhD.

COLLEAGUE Great! So you’ve finally started data collection, then…

ME (awkward pause) Well, I’ve been interviewing people…

COLLEAGUE But that is data collection, surely. Have you begun data analysis yet?

ME (awkward pause) Ummm… but how’s your study going? Have you heard back from the Ethics Committee yet? And how’s your partner getting on with the new job?

Research participants or human beings?

Ever since I began this project, I’ve had a niggling and non-specific aversion to the term ‘data collection’ being used to describe my research activities. Sometimes, though, words reveal more than we realise.

The OED defines data as:

Facts and statistics collected together for reference or analysis; the quantities, characters, or symbols on which operations are performed by a computer … things known or assumed as facts, making the basis of reasoning or calculation

Similarly, the FreeDictionary defines data as:

1. Factual information, especially information organized for analysis or used to reason or make decisions.

2. Numerical or other information represented in a form suitable for processing by computer.

3. Values derived from scientific experiments.

And the BBC’s GCSE Bitesize website provides an excellent explanation of the relationship between data and information and knowledge.

From these three sources, we could surmise the following:
  • Data is fact
  • Data is that which we collect for our research
  • Data is collected for analysis and for use 
  • Most of our thinking about data is informed by the quantifiable, and by our use of computers
Certainly, then, the concept of data collection as integral to the PhD process presents a challenge for PhD studies like mine, which seek to be as qualitative, as theoretical, as participatory, and as participant-led as possible. The term data collection presses the question of what we might be taking from participants, of what we might be doing with what they have given us, of what ownership of and control over what they have given us our participants might retain, and of therefore what responsibilities we might have towards them. As fellow human beings, my participants are more than simply pseudonymous nodes with attitude codes on an NVivo database.

What common terms in research, or in public health, make you uncomfortable?

Thursday, 21 March 2013

Little legs

Posted by Linda Penn

I was pleased that the train arrived to take me to Middlesbrough on a freezing January morning, although not so pleased that it was the cold train (heating in this train hasn’t worked for months). By the time I got to Middlesbrough station I was frozen through. Claire picked me up and took me to an annex at the back of what used to be St Cuthbert’s church. In this very cold and rather dark annex was a ‘community gym’ and I was there to interview South Asian women about their physical activity, as part of the evaluation of our preventive intervention feasibility study. By then I was so cold I would have preferred to tramp the treadmill to warm up or maybe even indulge in beginners’ Zumba. However, when the women started talking I forgot to be cold. Qualitative research can be such joy.

St. Cuthbert's Church, Middlesbrough, 1965
St Cuthbert’s church used to be near my uncle’s butchers shop, until the planners bulldozed the community to drive a road through the heart of the town and move people out to a concrete desert. I didn’t know, until my cousin told me recently, but they had apparently sold halal chicken from this shop. So there must have been a Muslim community in Middlesbrough for some time.

My great aunt Minnie’s sweet shop was also somewhere nearby St Cuthbert’s. I think she ran the shop from the front room of one of the little terraced ‘slum’ houses. This house too has long since been reduced to rubble. I only remember going there once and I was very young. Minnie was too old then to keep shop and my sister and I had been warned that Minnie had ‘little legs’. We were not to ask or comment. In fact, we should just pretend we had not noticed. The legs were not at all obvious when we arrived as she was sat in her big chair by the fire, with a rug over her knees. However after a while she got up to fetch the coal from the back kitchen. When she got up she was walking on her knees – the little legs. It was a shock, which must be why I remember. Nevertheless Minnie managed to negotiate down the stone step into the back kitchen to fetch the coal and obviously back up the step with the bucket of coal. I remember watching her. I am sure someone would have offered to go and get the coal for her, but she must have refused with such determination that no-one dared interfere. 

St. Cuthbert's Church, Middlesbrough, 2008
Not until years later did I appreciate that Minnie’s little legs were as a result of diabetes related amputations. That was my first introduction to the nasty, progressive and debilitating disease that is diabetes. It was pure serendipity that this January I was back almost where I started and the prevention message is the same. Although I hope the prosthetics have improved.

Thursday, 19 July 2012

Seeing is believing: exploring qualitative methods beyond text and talk

Posted by Shelina Visram (with Ann Crossland)

In the run up to the recent UKCRC Public Health Research Centres of Excellence meeting, I received an email asking for volunteers to help organise and deliver workshops. One of the suggested topics – ‘The use of novel qualitative methods in evaluation research’ – immediately caught my eye. I’ve been involved in a number of evaluations and most have relied on qualitative methods. So I put myself forward and was glad to hear Professor Ann Crosland had volunteered too. We decided Ann should do the bits on using commonplace methods in novel ways and I’d do the bits on visual methods. Then we went our separate ways to work on the content.

That’s when I stopped and thought: how much do I really know about visual methods? Yes, I’ve used them in a number of projects but I’m certainly no expert. I wondered who would attend this workshop. Would they be expecting to explore the philosophy of creative methods? Should I be using words like epistemology and ontology? Or could I get away with showing cute pictures drawn by small children? I decided the most sensible approach would be to hedge my bets and do a bit of both (without getting bogged down by philosophy).

Picture drawn by a 7-year-old when asked “What things affect your health?” during the evaluation of a weight management programme 
Here comes the science… Qualitative research relies heavily on the things people write or say. If you’re a positivist, you might ask how we know whether this information is ‘true’, i.e. does it accurately reflect the ‘real world’? We interpretivists tend not to worry about those things and instead accept the existence of multiple realities and therefore multiple versions of the ‘truth’. However, we still assume that what people write or say is a reliable account of their truth. Yet we know that people have different capacities and motives for sharing information. During interviews or focus groups, participants are telling particular stories in a particular social context. To what extent can we use these stories to draw interpretations about their lives outside of that context?*

This is part of the rationale for using visual methods. We acknowledge that the information people provide verbally or in writing is only ever partial and cannot be taken at face value. Visual methods give us an alternative means to examine their beliefs, attitudes, experiences and ideas about themselves. These methods are particularly useful in exploring the routine of daily life that tends to go unnoticed. For example, how many of us could describe our journey to work in any great detail? Yet if we were asked to draw, map, photograph or film our travels, we would undoubtedly provide a far richer picture of the same journey. Other examples of creative methods include spider diagrams, clay modelling, body mapping, and something called Lego Serious Play which I am desperate to try (but maybe with Fuzzy Felts – remember them?).

Advantages of using visual methods include the fact that they are interactive, encourage free expression, and often generate unexpected findings. They are also inclusive, in that they don’t require participants to be especially articulate in speaking or writing in English. I’ve used drawing in a project involving children from 4-years-old and this helped to give them a ‘voice’ in evaluating a service. Challenges include the potential to generate vast amounts of data that can be difficult to interpret, although visual methods are generally used alongside interviews and focus groups. This helps to engage participants in the process of interpretation. There are also ethical issues to consider; for example, consent is required if others appear in photos or videos.

It can take a lot of time, energy and resources to use creative methods in any research or evaluation activity. But I would argue that they represent one way of overcoming some of the criticisms about the validity and anecdotal nature of qualitative research. And they’re fun too.


*For an in-depth discussion of this argument, read this book.

Wednesday, 30 May 2012

Let’s get out of the office and see what’s really happening

Posted by Dorothy Newbury-Birch

When putting bids together for research we have to think carefully about how a project can happen ‘in the field’. We look at the evidence to date and often ask people who are working in said 'field' for advice on how things can work. But is this enough?

I would argue not always – for us to really understand what we are asking people who take part in research to do, we need to get out there and look for ourselves how things could work in practice. For example if I am working on a project where I would like ambulance staff to screen patients for alcohol use disorders how can I really know what normal practice is like without observing it for myself?

Hanging out with an ambulance crew - good fun, good research
I have, to date, carried out observational work for these very reasons, in an Accident and Emergency Department (AED) on black Friday - the Friday before Christmas. I quickly realised that asking AED staff to ask lots of questions about alcohol wasn’t really a good idea. In fact, just getting a cup of coffee that night was barely feasible. However, using a shorter questionnaire, perhaps at the triage stage, might be.

I also spent two weekends with an ambulance crew and learned that paramedics make small talk in the back of the ambulance with a lot of patients whilst they are being transferred to the AED. This makes it an ideal opportunity for research to take place. I also realised that quite a few people who paramedics are called to see, are not transferred to hospital. The paramedics were frustrated about not being able to do anything with these people (another opportunity for research).

I spent a night with the maxillofacial team in AED where I learned that they are slightly separate to the core AED staff and in the main do have more time (yet another opportunity for research). Finally I spent a couple of nights on a project with police and paramedics where I’m not sure what I learned, but it was fun.

Of course, there are loopholes to get through in order to do observational work like this, forms to be filled in (including risk assessments). I am always honest about my reasons for doing the work with the people I’m working with and this is important for good relationships. I always, always take goodies for the team (blueberry muffins, cherry bakewells).

Ultimately I think this observational work means we end up with better research. And it's really, really, really good fun. So give it a try.

Monday, 28 May 2012

Routine Secondary Data

Posted by Lynne Forrest

We all know what a nightmare it is trying to recruit participants for research studies. So if you only have to get hold of some routine data that’s just sitting there, well, that’s going to be much simpler, isn’t it? You’d think....

The plan for my PhD was to look at inequalities in cancer care by linking cancer registry and Hospital Episode Statistics data for lung cancer, and also linking to audit data. This is routine data that has already been collected and so I naively assumed it was just a case of getting ethical approval to access the data, finding someone to cobble the data together and off we go. I wrote an optimistic project timetable where I would get my hands on the data about seven months into the PhD. Eighteen months in I’ve finally got hold of some unlinked data and I’m still waiting for the rest.

I don't work for News International, so what's the problem? Photo: Christian Sinibaldi
So, what went wrong?

I think my first mistake was assuming that just because the data was there it would be easy to get hold of. There are a lot of hoops you have to jump through first.

I thought that what I wanted to do was simple but it turns out that it’s not. This is apparently the most complicated linkage that the cancer registry has undertaken and the bottom line was, nobody wanted to do it. I spend a lot of time begging people to speak to me and basically being fobbed off, in the nicest possible way. Luckily I eventually found a newly-joined analyst who was willing to give it a go. I’m not sure that she’s thanking me now...

Issues then arose of whether the data I wanted might be identifiable. Variables such as date of birth and death are classed as identifiable and individual records are ‘potentially-identifiable’, even if they don’t include identifiable information (which is an excellent catch 22 – they are identifiable even though they are not identifiable...)!

Finally it seemed like it was all coming together. I’d agreed with the registry that they would supply me with anonymised data containing ages rather than dates, I’d made it through ethics, and I’d got some data. But, on checking, not exactly the data I wanted. So, currently I am discussing with the registry how it will be possible for me to calculate survival time if they won’t allow me to have data on the number of days from diagnosis to death. Survival from lung cancer is short and rounding to the nearest year isn’t going to identify survival differences with any degree of accuracy.

The sticking point is that although they are not supplying me with date of death I could theoretically work it out from this information and that makes the data (aaagh!) ‘identifiable’. However, as I don’t have an NHS number, date of birth, or place of death, I don’t know how I would identify anyone from the 140,000 records I have. Plus I’m a researcher, not a News International journalist, and I’m not interested in anyone individually, so I’m not going to attempt to do this.

Can’t I just sign something to that effect and have the data I need please?

Wednesday, 25 April 2012

A room of one's own

Posted by Stephanie Clutterbuck

I have never read "A room of one's own". But I thought it made a snappy title for a blog post so I did what any self-respecting early career researcher does when she wants to make sure she is not talking complete nonsense- I Wikipedia-ed it. Turns out it fits quite nicely. You see Virginia Woolf believed that "a woman must have money and a room of her own if she is to write fiction". And although I have no interest in writing fiction I can see her point, a woman must have participants and a room of her own if she is to do science.


Virginia Woolf, by Frederico Novaro

There I was, March 2012, a bright-eyed PhD student confident in my experimental design, armed only with some predictions and a dream. Against my better judgment I believed that data collection in schools would be easy and as long as I asked nicely for ‘a quiet room’ my wish would be granted leaving my data collection to roll merrily along, untainted by extraneous factors.

Fast-forward two months, seven schools and 200 participants later and I have learned an invaluable lesson: schools have very different definitions of ‘a quiet room’.

At my first school I was shown to an open corridor where I was told I would run my experiment. Admittedly, I had to suppress my inner toddler from stamping her feet and screaming ‘This is NOT a quiet room!!’, but I made do. And in fact it would have worked well if the corridor wasn’t simultaneously being used as a makeshift studio for yearbook photos. And then as a meeting place for all the Year 5 boys to earnestly discuss the moral implications of stealing the Year 6’s football during break. To be fair it was a lively debate and I could see their point, why should the older boys get the ball - isn’t that ageism?

Still, data collection continues to roll along in various schools and I have become adept at managing my inner meltdowns regarding the unreality of tightly controlled experimental conditions outside of the lab. I was able to force a smile when a teacher barged into my quiet room (which happened to also be a kitchen) and rattled the contents of every drawer and cupboard in search of a knife to cut cake. And I have learned to tune out repeated renditions of ‘Kung Fu Fighting’ and ‘Heart and Soul’ sung by jubilant five year olds in nearby music rooms.

Fortunately, for my sanity, I feel data collection enlightenment is within reach. The other day I unflinchingly accepted that there was nothing I could do about the man in muddy overalls wielding a shovel and walking through my quiet room. Twice.